Measuring and analyzing Resolute Forest Products’ carbon footprint is an essential step toward reducing the environmental impact of the company’s operations. We have tracked and reported our carbon footprint since 2006, beginning with scope 1 and 2 greenhouse gas (GHG) emissions, and adding public disclosure of our scope 3 (value chain) emissions in 2013. In 2022, the Science Based Targets initiative (SBTi) validated our new emission reduction targets, which include a 41.5% reduction in absolute scope 1 and 2 emissions by 2026 from a 2015 base year, and a 16.5% reduction in scope 3 emissions within the same timeframe. For more information on our value chain emissions, please visit our Scope 3 Emissions webpage.
Disclosing our Performance
Resolute’s commitment to transparency and sustainability reporting includes disclosing our annual carbon footprint to CDP, a globally-recognized, non-profit framework that has long championed environmental disclosure as standard business practice. Participation in CDP’s disclosure programs allows organizations to measure their progress and drive action around their sustainability performance. We have reported our carbon footprint to CDP since 2006, beginning with scope 1 and 2 GHG emissions, and adding scope 3 emissions in 2013.
In CDP’s 2022 climate change program, we sustained a B score, maintaining our position at the management level. The ranking reflects the concrete actions we have taken on climate issues and the steps we have implemented to manage our carbon footprint. We are committed to continuing our participation in CDP’s climate change program on an annual basis. For more information, consult our 2023 CDP report.
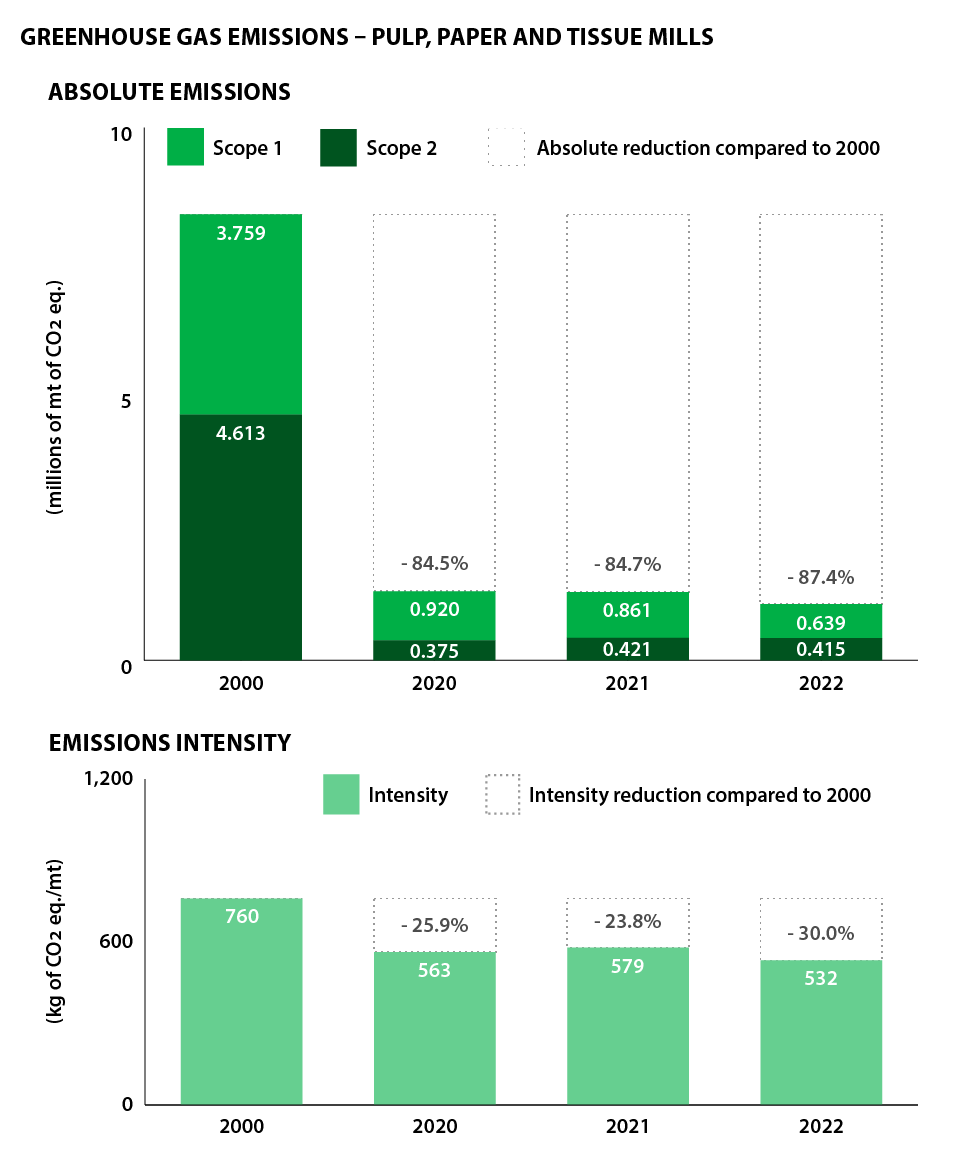
Our ongoing carbon-reduction efforts have reduced our scope 1 and 2 absolute GHG emissions across all manufacturing facilities by 46.2% compared to 2015 levels, building on a 87.4% reduction in scope 1 and 2 emissions at our pulp, paper and tissue mills since 2000. That is the equivalent of removing close to 1.6 million cars from the road, or more than 7.3 million metric tons of CO2 equivalents per year.

Here is a snapshot of the emission-reduction initiatives we have undertaken since 2015:
GHG Emission Reduction Initiatives
| Operations |
Projects |
GHG Emission Reductions |
Saint-Félicien (Quebec)
Pulp Mill |
C$61 million strategic investment plan, including $22 million to reduce GHG emissions by 20% |
Approximately 35,000 mt of CO2 equivalents per year
Project to be completed in 2022; already achieved reduction of 15,000 mt per year |
Coosa Pines (Alabama)
Pulp Mill |
Modernized the cogeneration turbine for a 30% reduction in purchased electricity use between 2015 and 2020 |
Approximately 30,000 mt of CO2 equivalents per year |
Clermont (Quebec)
Newsprint Mill |
Replaced bunker C oil with an electrical boiler powered by hydroelectricity |
1,800 mt of CO2 equivalents per year |
Dolbeau (Quebec)
Paper Mill |
Reduced the use of the auxiliary boiler fueled with bunker C oil |
1,600 mt of CO2 equivalents per year |
Sanford and Hialeah (Florida)
Tissue Mills |
Participating in SolarTogether™, a shared solar program offered by Florida Power & Lighting |
Approximately 8,000 mt of CO2 equivalents per year |
*metric tons
Greenhouse Gas Emissions
GHG emissions, such as carbon dioxide (CO2), methane (CH4) and nitrous oxide (N2O), are mostly generated by the combustion of fossil fuels at various stages in the pulp, paper and tissue making process. Methane is also produced when process waste decomposes in landfills.
Resolute relies on the Fourth Assessment Report of the United Nations Intergovernmental Panel on Climate Change (IPCC) for global warming potential (GWP) rates over a 100-year horizon in order to convert non-carbon dioxide emissions into the standard measure of carbon accounting: carbon dioxide equivalents (CO2e).
The company reports GHG emissions according to the Greenhouse Gas Protocol and follows the requirements of the U.S. Environmental Protection Agency, the Quebec Ministry of Environment, Climate Change, Wildlife and Parks, the Ontario Ministry of the Environment, Conservation and Parks, and Environment and Climate Change Canada, depending on the jurisdiction in which our facilities are located.
The Greenhouse Gas Protocol is a tool used widely by governments and businesses to calculate and manage GHG emissions, providing standardized methods and industry-specific calculation tools for corporate accounting and reporting. A long-standing partnership of the World Resources Institute (WRI) and the World Business Council for Sustainable Development (WBCSD), it works with a variety of global stakeholders to tackle climate change with GHG inventories and management tools. Visit www.ghgprotocol.org for more information.
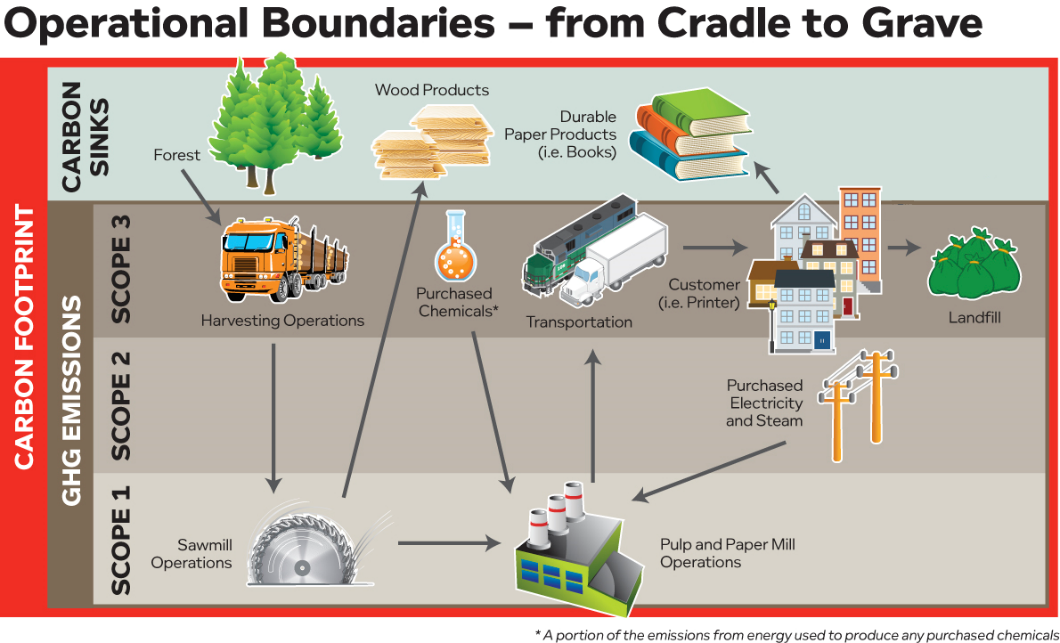
To standardize and provide transparency in reporting, operational boundaries are set GHG emissions are tracked under three scopes defined by the Greenhouse Gas Protocol:
- Scope 1 includes direct emissions from controlled and/or owned sources by the company
- Scope 2 covers indirect emissions from the generation of purchased energy, such as electricity and steam consumed by the company
- Scope 3 includes all other indirect emissions not covered in scope 2, and that occur in the company’s value chain
The Carbon Cycle, Carbon Sinks and Avoided Emissions
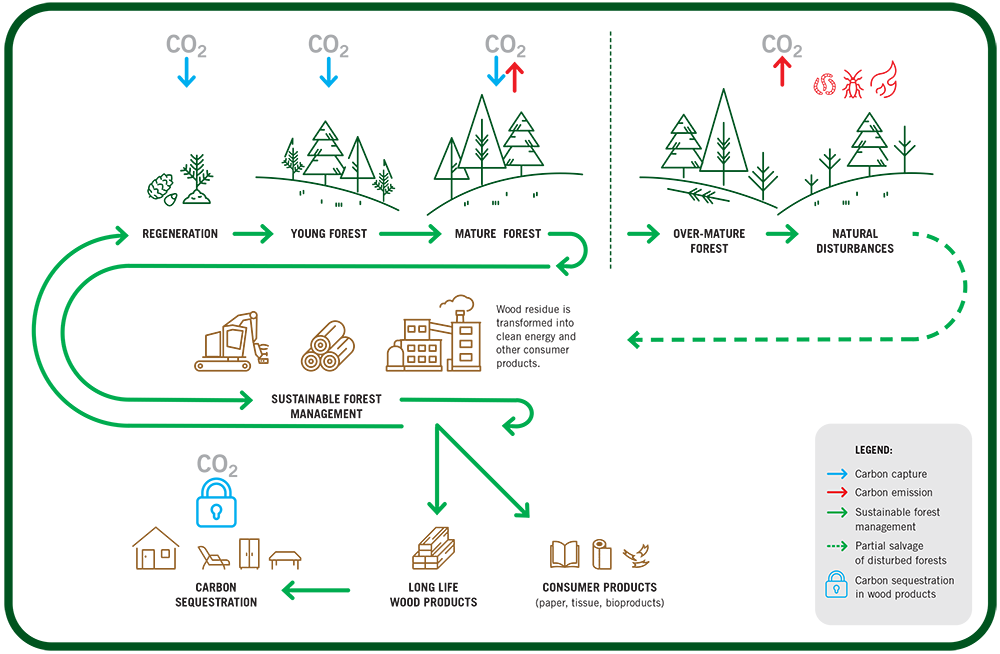
Forests both store and release significant amounts of carbon as part of a natural cycle. Responsible forest management not only reduces the forest’s potential as a carbon source, it can also increase the effect of its carbon storage capacity. Carbon moves in and out of the atmosphere through a natural process called the carbon cycle. Some years, forests hold more carbon than they release. When they capture more CO2, they are called carbon sinks.
The process of capturing CO2 from the atmosphere and storing it over time is called sequestration. Trees store carbon by converting CO2 into plant material through photosynthesis, which uses the energy from the sun and releases oxygen. When a tree is harvested and milled into lumber, a small amount of that carbon escapes, but most of it remains trapped within the cellular structure of the wood, effectively prolonging the effect of sequestration.
Wood products, as well as books, magazines and other durable pulp and paper products, store the carbon that began in the forest, while reusing and recycling these products avoids methane emissions that occur at the landfill. Carbon sinks and avoided emissions can be subtracted from the emissions generated in the life cycle of forest products.
Forest Carbon Cycle

For more information, check out our blog post on Avoiding Carbon Emissions by Building with Wood.
"Cradle-to-Grave" Carbon Footprint
The carbon footprint of a product is the sum of the GHG emissions associated with its entire life cycle. For pulp, paper and other forest products, this life cycle spans the forest and manufacturing process through to the recycling center and landfill, minus sequestered or avoided emissions.
The diagram below illustrates the operational boundaries of the GHG emissions and carbon sinks attributed to the manufacture, delivery and end-use of our products.
